ChartDirector

Publicado:
2014-08-22 10:13 @468por seafree
Hola. Me podrán apoyar con el manejo de configuración del formato de etiquetas en las gráficas de ChartDirector setLabelFormat.
Espero alguien me responda, para plantearle la situación.
Gracias.
Re: ChartDirector
Publicado:
2014-08-22 11:56 @538por seafree
Utilizo la siguiente sentencia para dibujar una gráfica de PIE en Chartdirector:
$c->setLabelFormat("<*block*>{label}<*font=arialbd.ttf,color=FF0000*> \${value}K<*br*><*block*>\n <*block,halign=center*><*color=000000*>({percent}%)<*block*>");
Pero necesito que el parámetro ${value} tome los valores de un arreglo distinto a los de los sectores de la gráfica, no usado en los parámetros de la gráfica. Así creé un arreglo independiente y necesito usar el arreglo creado para representarlo como value.
Les agradezco su valioso apoyo, saludos.
Re: ChartDirector
Publicado:
2014-08-22 15:38 @693por explorer
Las etiquetas, junto con los datos, se definen con el método setData().
Te valdría con cambiar la referencia al del
array con las etiquetas, ¿no?
Using perl Syntax Highlighting
#!/usr/bin/perl
use perlchartdir;
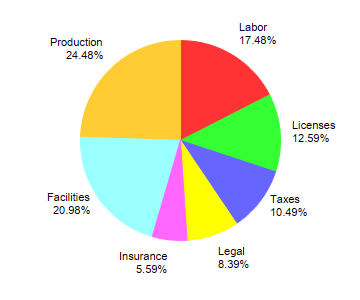
# The data for the pie chart
my $data = [25, 18, 15, 12, 8, 30, 35];
# The labels for the pie chart
my $labels = ["Labor", "Licenses", "Taxes", "Legal", "Insurance", "Facilities", "Production"];
# Create a PieChart object of size 360 x 300 pixels
my $c = new PieChart(360, 300);
# Set the center of the pie at (180, 140) and the radius to 100 pixels
$c->setPieSize(180, 140, 100);
# Set the pie data and the pie labels
$c->setData($data, $labels);
# Output the chart
$c->makeChart("simplepie.png")
Coloreado en 0.003 segundos, usando
GeSHi 1.0.8.4
 Más ejemplos de tartas
.